Pulse answers the question people open a report with in the morning: “are we on track for the goal, what changed and what are we doing about it”. It puts the sprint goal, the agenda for the day, what the system found and the team’s hypotheses on one page, and ties them together with one number: how much is missing to reach the goal and how much of it the work already launched covers.
It is the first report in Reports. You add sections to it the same way as to any report.
What you see here
A sprint is a period of work toward one goal: one to eight weeks, one, two, three or six months, or a year. A sprint is a plan from Planning: the plan has a date window, a goal metric and a target. The report takes the plan whose window covers today.
The sections go from top to bottom.
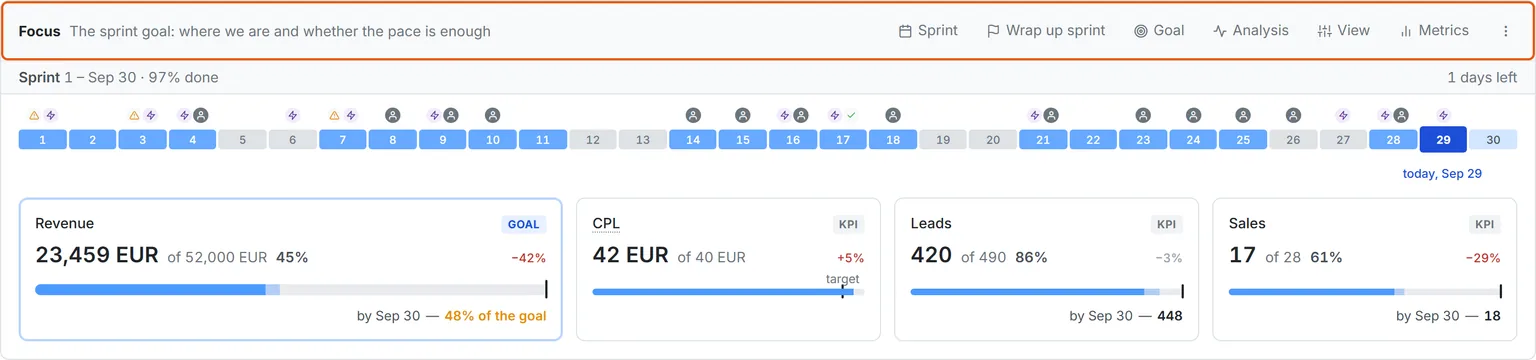
Focus — where we are against the goal. Above the tiles is the sprint bar: one cell per day, past days coloured by actuals, future days by the forecast. Below it are tiles for the goal and the metrics next to it (KPIs): actuals, target, percent done and the forecast by the last day of the sprint. The goal tile shows how much the hypotheses in progress cover.
Today — the day’s agenda as cards: what happened, what to decide, how to finish the week. The set of cards depends on the scenario: at the start of the week it reviews the last one, in the middle it shows only exceptions, at the end it checks whether the goal is on track. A card appears only when it has something to say; cards that wait for you are marked needs a decision.
Insights — what the system found in the project data, in three groups: Can the numbers be trusted (broken or missing data), What matters for the goal (what moves the goal metric) and More (no established link to the goal). Click a row to open the Decision breakdown with two tabs, In short and In detail: what happened, which data shows it and what to do.
Hypotheses — what the team changes and what it expects from it: metric, size, confidence, check period, result. Above the table is the coverage line: how much is missing to the goal, how much we expect from hypotheses and how much nothing covers.
Set it up for your question
Set the sprint goal
The sprint is created in Planning: that is where you choose the window, the length and the goal metric. While there is no plan with a goal for today, Focus shows No sprint goal set and the Open “Planning” button.
Once there is a sprint, you can change the goal from the section itself:
- In the Focus section panel, click Goal.
- Pick a metric. Your choice is saved to the sprint plan right away.
- If there is no target to the right of the metric, enter it in the sprint target field on the tile.
Pick the metrics next to the goal with Metrics — up to five. Drag them in the same menu to set the order of the tiles and save it with Apply. The sprint name, start and length can be changed with the Sprint button; a target that is already set is changed in Planning.
Optional:
- View chooses the Marks on the sprint bar (Insights, Data insights, Team activity, Launched hypotheses, Calendar dates, Data gaps) and what the tiles show — Progress or Trend, with or without Percent done and the What hypotheses cover line;
- Analysis adds Change from the previous period and Forecast for the end of the sprint to the tiles.
You can also put Focus into any report of your own: Add section… → Focus. It takes the goal from the same sprint plan.
Choose the Today scenario
- In the Today section panel, click Scenario.
- Keep Auto — the scenario is picked by the day of the week and the sprint — or fix your own: Week review, Ongoing work, Week finish, Sprint result.
Cards turns on and off the cards the scenarios pick from. A card that is off does not appear in any scenario.
Add a hypothesis
A hypothesis is a change with an expected effect: “we change X and expect the metric to move by this much”. Subtasks and discussion stay in your tracker; KO keeps only what a number can check.
- In an insight row, click Test a hypothesis… — or click Add hypothesis… in the Hypotheses section panel, type what you are doing and click Add. The New hypothesis panel opens.
- Check the description of the change in What we change. A hypothesis from an insight already has the action from the card.
- In Expected effect, choose the Metric and enter the size: from, to or both. A hypothesis from an insight gets the insight’s metric, your own gets the sprint goal metric; you can change it.
- Choose the Confidence: sure, should help or a try.
- In Check the effect after, choose how many days after “Done” to look at the metric: 7, 14 or 30.
- Optional: Who, Do by, Week and Link in your tracker.
- Optional: in What we will see on the way, choose the Early sign — a metric that moves before the goal — then its Direction and When to check after “Done”: after 3 or 7 days. Also optional: What may drop — a metric that must not suffer. A hypothesis from an insight gets both fields from the card, if the card names them.
- Click Create hypothesis.
A hypothesis without a metric and a size is not saved: there is nothing to check it against. The early sign is checked before the check period ends: if Check the effect after is 7 days, only 3 is left.
When the change is made, set the status in the hypothesis row to Done — or open the hypothesis and click Mark as done. After the check period, set the Result right in the row: worked, did not work or went away on its own. “Went away on its own” means the metric came back while we did nothing; it is not counted as “worked”, or the next expectations would be too high.
Show in the Hypotheses panel chooses which rows you see: In progress, Waiting for result, Closed.
Wrap up the sprint
The Wrap up sprint button appears in the Focus panel in the last quarter of the sprint.
- Click Wrap up sprint. A panel opens with the goal and KPI numbers.
- In Waiting for effect, set the result for hypotheses where it is already clear. The result is saved right away; not sure yet — leave it, the hypothesis keeps waiting in the next sprint.
- In Hypotheses in progress, choose To next sprint or Close for each one, or click Move all. Nothing moves on its own.
- Click Save review.
The numbers are saved as a snapshot, and the review opens read-only later with the Sprint review button. The next sprint is a copy of this one: the same length, goal and KPIs. Change it in Planning.
If the sprint has ended without a review, a line above Focus says The sprint ended on … and has no review yet, with the Wrap up sprint and Start next sprint buttons.
A project manager changes hypotheses and wraps up the sprint. Any member can choose the goal and KPIs.
How to read it
The forecast follows the pace, not a straight line. KO spreads what is still to come over the remaining days by how the project’s week usually goes. Days off in the project calendar count as zero, so a holiday does not read as a drop.
“Hypotheses cover ≈ …” is adjusted for confidence. Each hypothesis’s expected effect is multiplied by its confidence: sure — 90%, should help — 50%, a try — 10%. Only hypotheses on the goal metric count.
“Measured” under the result shows timing, not proof. KO compares the metric over the same number of days before “Done” as have passed after it. The line suggests a result, but a person sets it: something else could have moved the metric on the same days. The hint names the dates compared: in the table, hover over the line; in the hypothesis panel, it is right below it. If other hypotheses changed the same metric on the same days, the hint lists them: they share one result, and the measurement cannot split it.
“The early sign did not appear — you can drop the hypothesis”. The early sign metric has not moved the right way by its day. When the early link does not move, the goal usually does not move either, so you do not have to wait for the check period.
“Dropped: …” — the metric from What may drop fell over the same period. The goal may have grown at its cost: before you set worked, decide whether the gain is worth that price.
A red line under a day on the bar is a data gap. A source that usually sends data on this day of the week sent much less. Today does not count: it is not over yet. A source that is silent anyway is not counted as a gap.
The Data gap card comes first in every scenario. “No data since …” — the source is silent now, and it needs a decision. “Gap on …, data came back after” — it is in the past, but the numbers for those days are too low.
A dismissed insight leaves the list. In the row’s More actions menu, choose why you dismiss it: Not relevant now, The conclusion is wrong, Not clear what to do or Just hide it. If things get worse, the system shows the insight again.
If there are no numbers
- “No sprint goal set” — Planning has no plan with a goal for today. The Open “Planning” button takes you there.
- “Several plans with a goal cover today, and none of them is marked as the main one” — the windows of two plans overlap. Mark the main one in Planning.
- “Nothing to show in this scenario today” — all is calm: a scenario’s cards appear only when they have something to say. If it says all cards are turned off, turn them on in Cards.
- “No open insights” — the system found nothing or everything is handled. If it says the insights are hidden by the filter, tick the levels you need in Priority.
- “No hypotheses in progress” — add your own or test an insight. The table can also be empty when every box in Show is unticked.
Related
- How a report works — sections, the window, your own reports.
- The Planning section — the sprint plan, the goal and KPIs.
- What to do now — the system’s findings in more detail.
- Project calendar — the working week and holidays the forecast takes into account.
- Diagnostics — what is broken in the data and when.