- Formula
spend / leads- Unit
- Currency
- Direction
- Lower is better
- Across periods
- Recomputed from totals, never averaged
- In KO
cpl
CPL is spend divided by the number of enquiries: what you paid for one person to leave their contact details. It is simple, every ad platform reports it, and that is exactly why it ends up being the number campaigns get optimised against.
Which is the problem. CPL measures the price of a contact, not the price of a result, and optimising for it moves budget towards whatever produces cheap contacts — reliably, and usually away from whatever produces deals.
The formula
CPL = spend / leadsSpend €10,000, receive 250 enquiries:
10,000 / 250 = €40Its neighbour is almost always cost per qualified lead — the same division, but by the enquiries that survived qualification. The gap between the two numbers is precisely what CPL hides:
| Formula | What it measures | |
|---|---|---|
| CPL | spend / leads | the price of a contact |
| CP QL | spend / qualified leads | the price of a contact sales can use |
If 50 of those 250 enquiries qualify, CPL is €40 and CP QL is €200. A channel at €40 CPL with a 5% qualification rate is more expensive than one at €90 CPL with a 40% rate: €800 against €225 per useful contact. On CPL the first one looks twice as good.
What it does not show
It does not know who arrived. A lead is the fact of a form being submitted, not the fact of interest. A bot, a competitor, a job applicant, someone who missed the button they meant to press, and a buyer with a budget all enter the denominator at equal weight. Any channel where the form is easy to submit produces a low CPL by construction.
It does not survive a change in the definition of a lead. Does a newsletter signup count? An unanswered call? An enquiry from an existing customer? The answer is a setting, not a fact, and changing it moves CPL without moving spend or sales. Two CPLs computed under different lead definitions are not comparable, even when both are yours.
It does not see duplicates. One person who submits three forms in a week is one contact and three rows in the denominator. Channels with high repeat activity — retargeting, email — get a flattered CPL purely because the same person is counted three times.
It says nothing about scale. CPL is an average over money already spent. The next €10,000 will almost certainly buy more expensive contacts: the cheapest audience is bought first. Campaigns with an excellent CPL on a small budget routinely fail to hold it at triple the spend.
How it breaks
Averaging across periods. CPL is a ratio, so a quarter’s CPL is not the mean of three monthly CPLs:
Right:  Σspend / Σleads
Wrong:  (CPL_jan + CPL_feb + CPL_mar) / 3
The two diverge whenever spend is uneven across periods. A month with small spend and a lucky burst of enquiries produces a tiny CPL that then drags the “average” down with a weight it never earned.
Spend and leads measured in different places. Spend comes from the ad platform, leads come from the CRM or the website, and the two almost never cover the same set: the platform knows nothing about organic, and the CRM never saw the enquiries lost before they reached it. Putting them in one fraction is only honest once you have said which leads belong to that spend.
Zero spend in a neighbouring row. Organic and direct produce leads at no cost. CPL there is undefined — not zero. A report printing €0 is telling you your best channel is free; a report printing an empty cell is telling you the truth.
Leads with no source. Every enquiry that cannot be tied to a channel drains out of the denominator of specific campaigns and settles in an “unknown” row. The spend stays where it is, so the CPL of every paid channel is overstated by exactly the share of attribution you lost.
How KO calculates it
In KO, cpl is a derived metric with the formula spend / leads. Spend comes from the ad
platforms’ own data; leads are the project’s lead entities rather than form events, so three
submissions from one person collapse into one lead wherever that could be established.
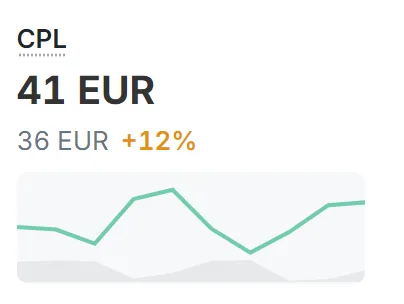
Being derived, it is recomputed from summed inputs at every level of the report — on the
campaign row, on the segment, and in the total — and is never averaged up from the level below.
A quarterly figure equals Σspend / Σleads by construction, which is why the averaging mistake
cannot happen in a KO report.
Where there are no leads the result is empty (—), not zero: an undefined ratio is shown
as undefined.
The numerator depends on the attribution model applied to the report, as it does for every cost-per-result metric. CPLs taken under different attribution windows are not comparable.
Related
- Cost per qualified lead — the same division one stage later, where it is already visible whether the contact was worth having.
- Lead-to-qualified conversion rate — the multiplier between the two numbers: it is what turns a cheap CPL into an expensive CP QL.
- Qualified lead — what actually counts as an enquiry that reached sales.