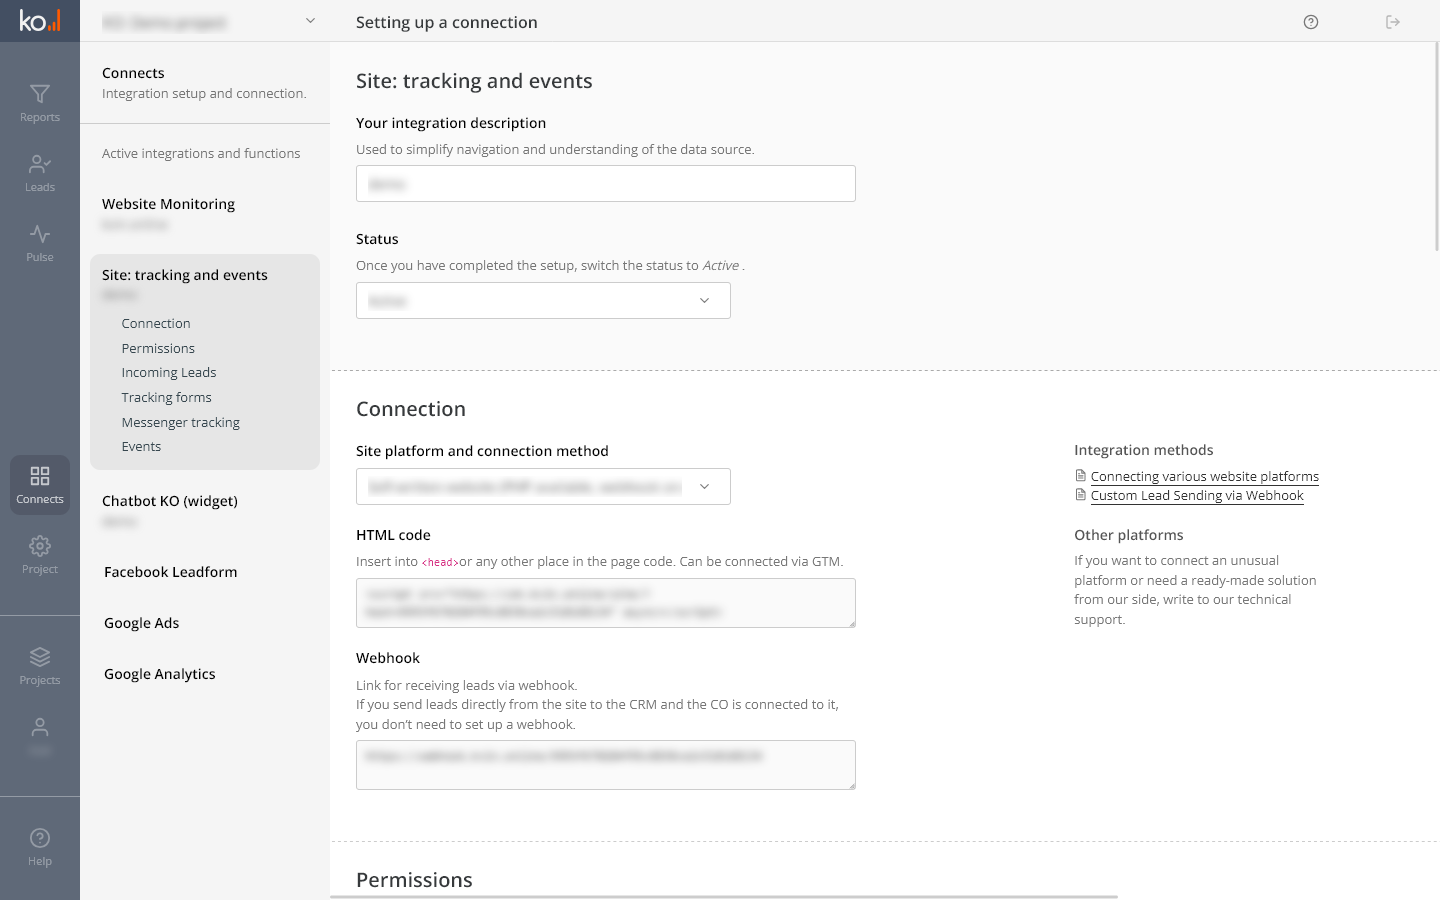
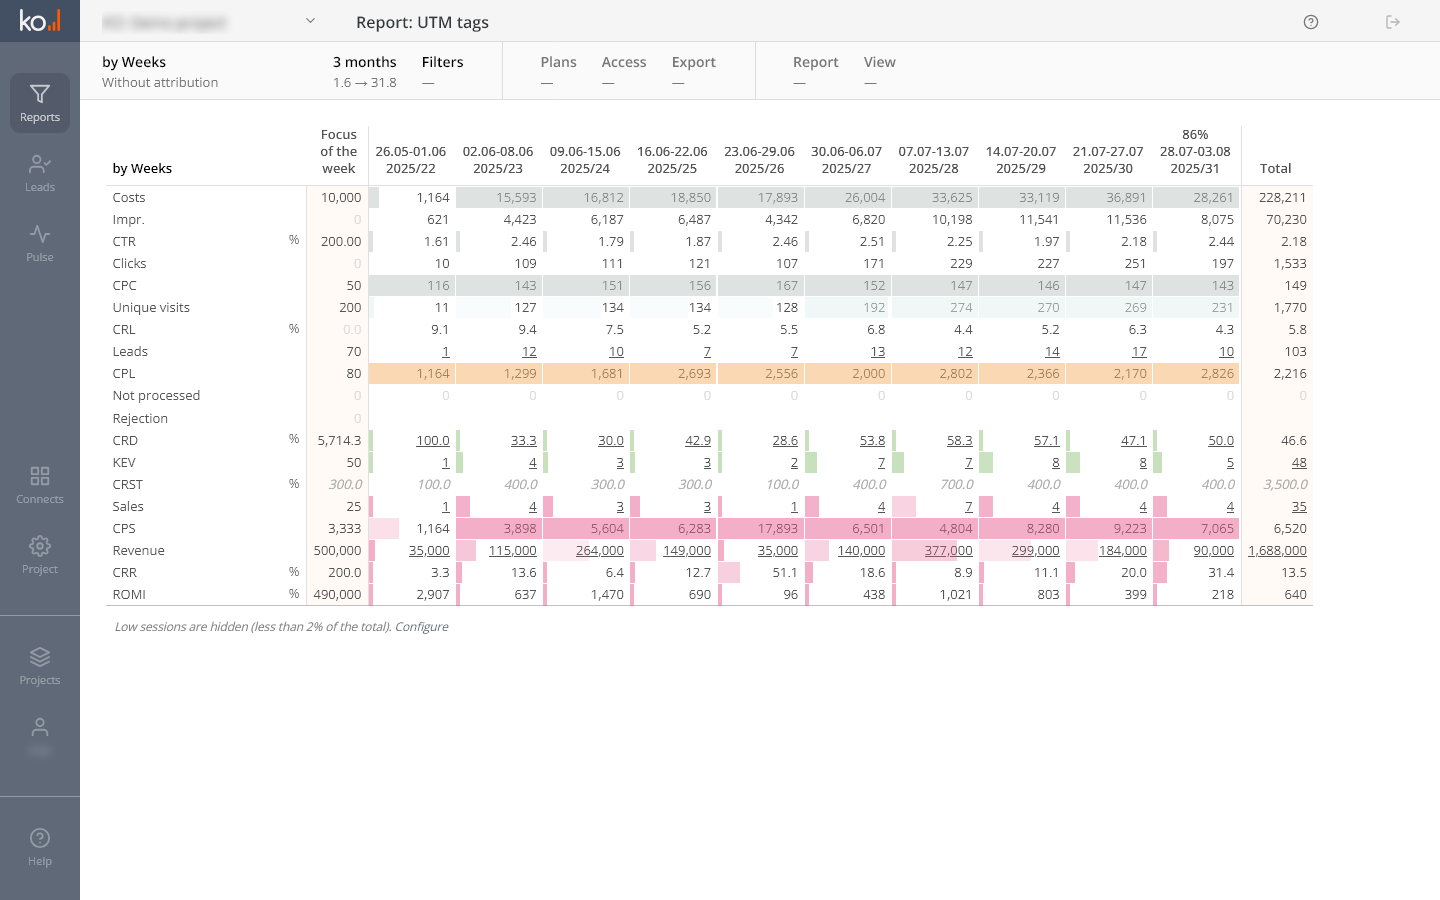
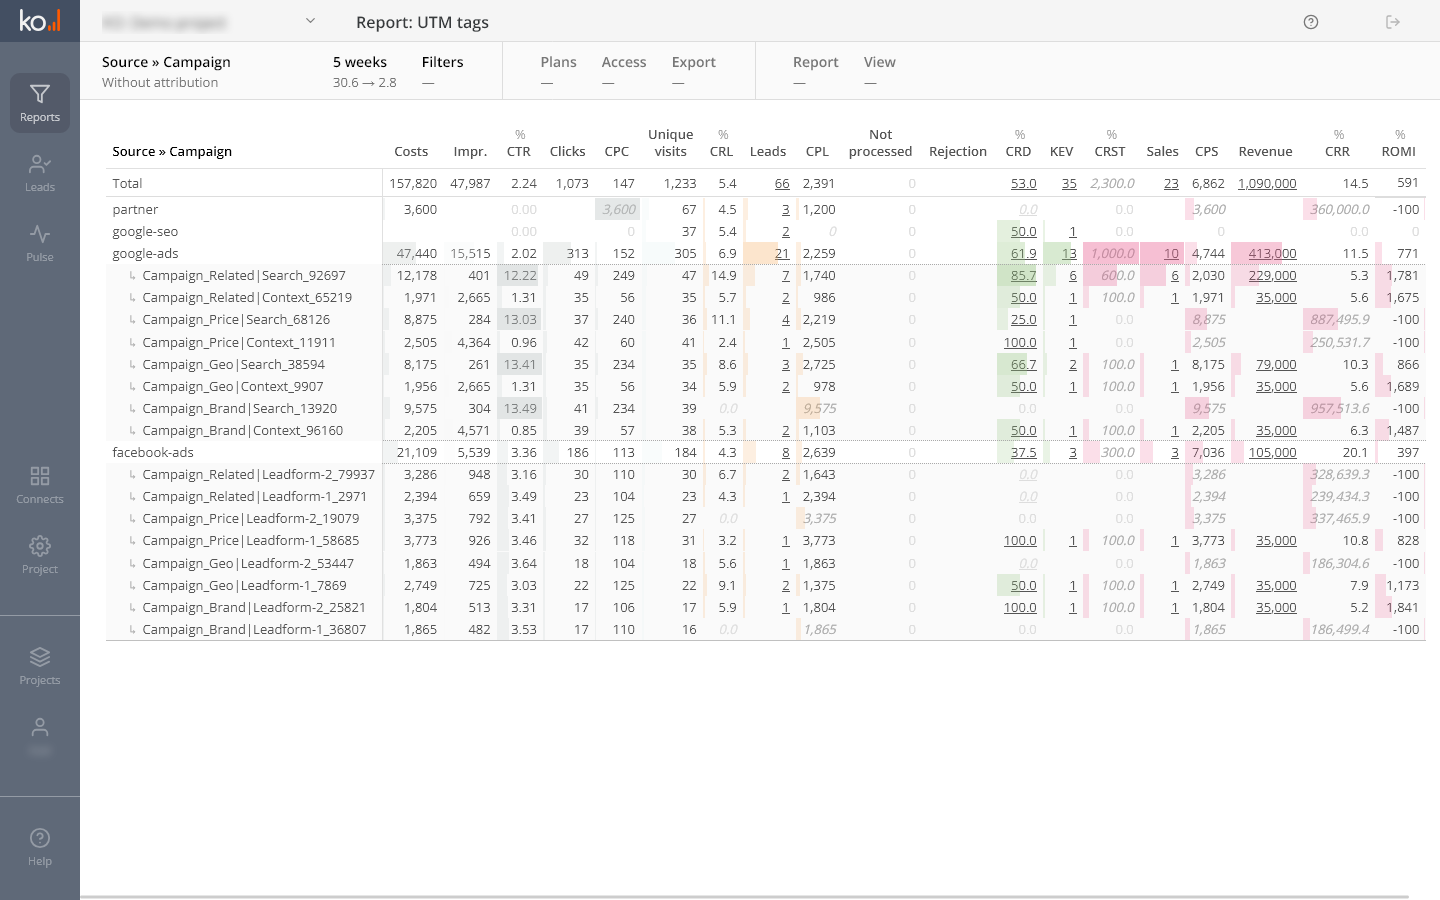
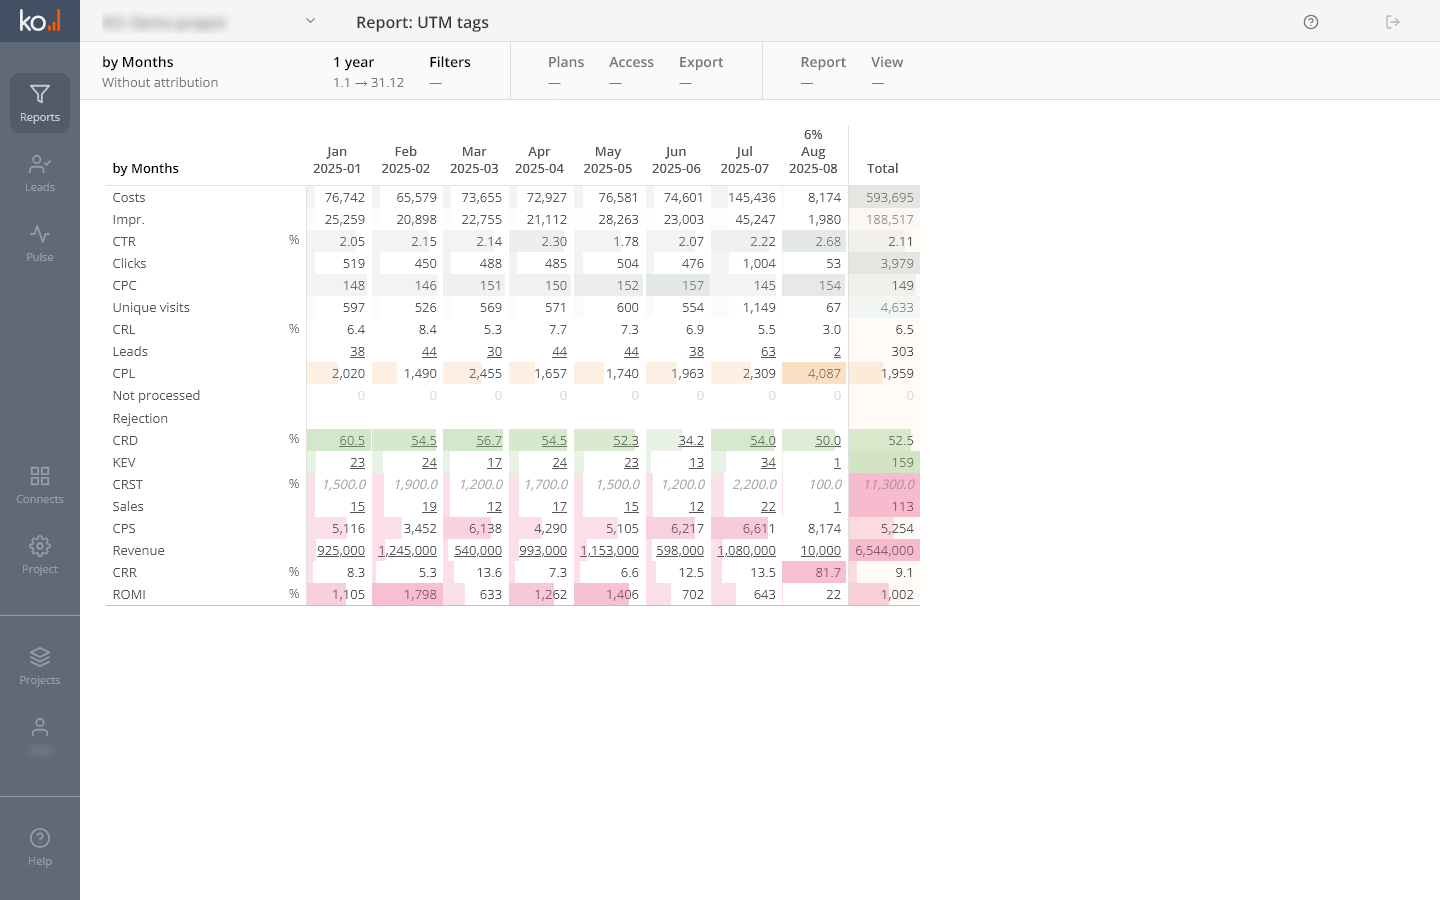
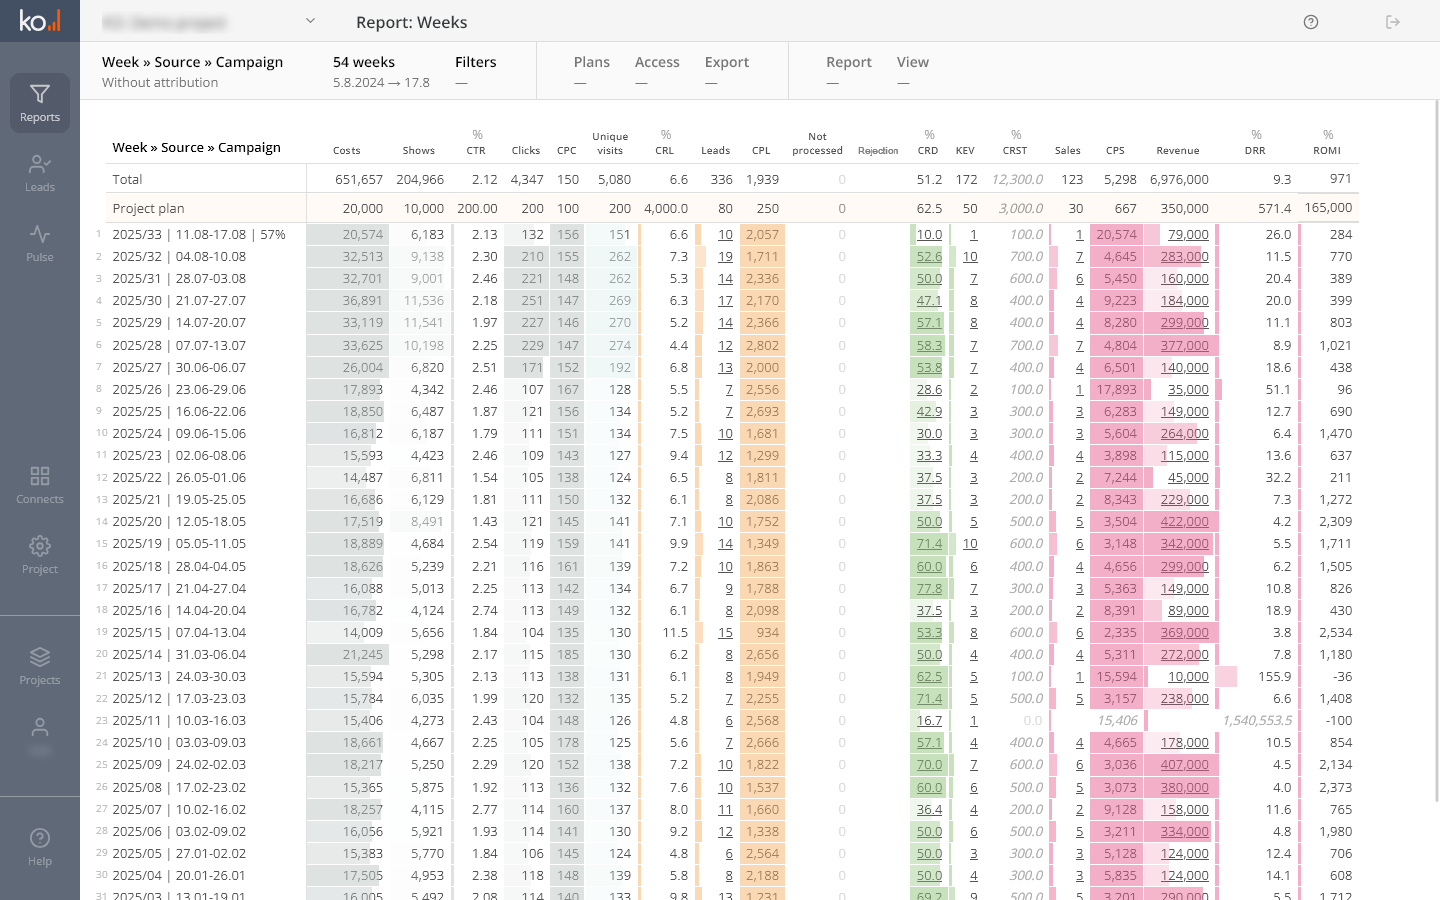
Revenue-focused intelligence platform for growth teams

Turn marketing
and sales signals
into
clear revenue decisions

KO brings together marketing, sales, and revenue context to show where your revenue engine breaks, what’s getting in the way, and what your team should do next to hit your revenue goal.

  • Clear next steps, not more dashboards
  • No data team required to get started
  • Launch a working system in 10 days
How it works
GDPR-compliant Proven by 100+ projects Used across SaaS, Recruiting, Real Estate, EdTech, and eCom
"We finally stopped arguing about numbers — marketing and sales see the same revenue now"
George D.
Head of Growth
"We discovered 40% of our ad spend wasn’t driving revenue"
Arthur I.
Performance marketer
"Now every growth decision is based on revenue, not assumptions"
David B.
CEO / Founder

You have dashboards.
You have data.
But your decisions are based on the wrong signals.

Google Ads shows 200 conversions. Your CRM shows 12 closed deals. Someone is lying — and you don’t know who.

One channel is burning 60% of your budget with nothing to show. But all of them look fine in the dashboard.

Your team spends 2 days a week stitching spreadsheets and arguing about numbers. Still no answer.

So you end up scaling the wrong things.

You scale what looks good.

You cut what looks bad.

But your data doesn’t reflect real revenue.

This isn’t a data problem.
It’s a revenue leak.
And it compounds every day.

How it works

How KO turns ad spend, CRM, and funnel data into decisions

Connect your ad platforms, CRM, and analytics tools

Bring your key revenue data into one system — without building a data stack.

Revenue data ready.

Validate and match the data automatically

KO detects broken tracking, missing UTMs, and mismatched numbers across systems.

Accurate, matched revenue data.

See revenue by channel, campaign, and segment — and act

One dashboard shows where money comes from, where it leaks, and what to do next.

Know what to cut, fix, and scale.

Result

A working revenue system in ~10 days

No data engineer, no analyst needed. Connect your tools — and start making decisions based on real revenue data.

What you'll see

Every channel. One decision

Slice it by channel, campaign, segment, or CRM stage — each view shows revenue and what to do next.

Channel
Monthly Spend
Attributed Revenue
ROMI
Decision
Google Ads (brand)
€14,200
€67,400
4.7×
↑ Scale
Meta Ads (prospecting)
€11,800
€8,700
0.74×
↓ Cut
LinkedIn Ads
€9,400
€18,200
1.9×
→ Fix — too many unqualified leads
Email retargeting
€1,200
€31,600
26×
↑ Scale — highest ROMI

Example data. KO generates this view for your actual channels — updated daily, from day one.

Capabilities

See what drives revenue — and act on it

Ad spend, CRM deals, and funnel data — all pointing to your next revenue decision.

Pillar 1 — Revenue capture

Capture and match your revenue data

Connect ad platforms, CRM, and site events into one revenue view — without building a data stack.

  • Ad spend, leads, and deals in one system
  • Track CAC, ROMI, and LTV without manual work
  • See which channels bring revenue — and which drain budget
  • Up and running in days — no data engineer needed
Total Ad Spend
€38,400
↑ This month
Attributed Revenue
€141,200
ROMI 3.7×
Customer Acquisition Cost
€44.60
↓ 14% vs last month
But are those numbers real?
Pillar 2 — Data validation

Validate what can be trusted

Detect broken tracking, missing UTMs, and mismatched numbers automatically — before they cost you revenue.

  • Spot broken tracking before it skews your decisions
  • Fix attribution gaps — match spend to actual deals
  • Capture 20–40% more conversions with server-side tracking
Google Ads: conversion tag not firing Broken
LinkedIn: 12% UTM mismatch detected
Meta Ads ↔ CRM attribution matched
Server-side: +34% more conversions vs pixel
Now find exactly where revenue leaks.
Pillar 3 — Revenue insights

Get insights without digging through dashboards

See where revenue is lost, where leads drop, and what actually drives results — without building reports.

  • See exactly where leads drop — and cut what doesn’t convert
  • Spot budget waste before next month’s report
  • Scale what drives revenue — based on real pipeline data
  • Get clear next steps — not more charts to interpret
Revenue funnel · Last 30 days
Leads in
1,240
Qualified
840
Deals
320
↓ 62% drop Most loss happens here
Won
88
Revenue attributed €112,000
Now put that data to work everywhere.
Pillar 4 — Data activation

Feed ad platforms. Export to BI

Send validated data back to ad platforms and export clean, matched data to external BI tools.

  • Send conversions to Meta, Google, and LinkedIn via API
  • Improve ad platform targeting with accurate revenue signals
  • Export clean data to BigQuery, Looker, or any BI tool
  • Scale what works — with data your whole stack trusts
Data activation
Meta Conversions API Active
Google Enhanced Conversions Active
LinkedIn Insight Tag API Active
BigQuery export Syncing
Revenue clarity

This is what teams actually need to know

The questions that matter — and now you can finally answer them.

Why don't marketing numbers match CRM revenue?
Where is the real bottleneck in our funnel right now?
Can the sales team handle more leads if we scale spend?
How much revenue can we realistically generate in 3–6 months?
Which campaigns should we scale, cut, or stop right now?
Connected to revenue

Connect 50+ tools — from ad platforms to CRM and analytics

Spend, CRM, and funnel data — all matched into one revenue view.

Every data source connected to real revenue outcomes

Not just synced — matched to actual deals, spend, and funnel events

Missing an integration?

Case Studies

Teams that stopped guessing. Results that prove it.

Each team found money they didn’t know was being wasted.

eCommerce / DTC Revenue Manager · RevOps

Found which of 15+ ad accounts drove revenue. In 2 days

Spending across 15+ accounts with no way to see which actually closed deals in CRM.

  • Revenue attributed per account — no new BI stack needed
  • Budget reallocated to high-converting accounts
  • Live in under 2 business days
Real Estate Performance Marketing

Reduced CAC by 60% after fixing broken tracking

Revenue numbers didn't match ad platform reports. No one knew where the gap was.

  • 35% of attributed leads were ghost entries — detected automatically
  • Broken UTM tracking found and corrected
  • Budget moved to real-converting channels — CAC dropped 60%
B2B SaaS Founder · VP Sales

Saved €40K — bottleneck was sales, not marketing

About to cut ad spend due to low pipeline conversion. The data told a different story.

  • MQL-to-SQL drop found in the funnel data
  • Root cause: sales process, not ad targeting
  • €40K ad budget preserved — sales process fixed instead
HRTech / Recruitment CMO · Growth Manager

Finally saw which channels drove hires — not just leads

30+ data sources, but no way to connect marketing activity to actual revenue outcomes.

  • All sources connected in under 2 weeks — no engineers
  • Discovered 2 channels with high lead volume but zero revenue conversion
  • Reporting time cut by 80% — team focused on decisions, not data prep
Pricing

Priced for ad spend — not seats

Usually costs less than 1% of ad spend. Often pays back by uncovering wasted budget in the first month.

/
Monthly Annual (save 20%)
Starter
Up to €5K/month ad spend · up to 1,500 leads/month.
99
/ month
  • 10 data sources
  • 1 CRM integration
  • Daily data refresh
  • First-touch & last-touch attribution
  • 30+ ready-made report templates
  • 3 users included
  • Email support
Scale
€150K+/month ad spend · up to 20,000 leads/month.
899 +
/ month
  • 100 data sources
  • Unlimited CRM integrations
  • Real-time data refresh
  • First-touch, last-touch & any-touch attribution
  • API access & webhooks
  • Export to BI tools
  • Custom integrations
  • Advanced actionable insights
  • Priority support
  • Dedicated account manager

No credit card  ·  Cancel anytime  ·  Upgrade anytime

FAQ

Still unsure? Here's what teams ask before they start

Those tools show activity — clicks, sessions, conversions. KO shows revenue.

We connect ad spend directly to CRM deals, so you can see which campaigns generate money — not just leads.

Most teams already have dashboards. They just don't have revenue decisions.

That's exactly the problem KO is built for. Most teams have broken tracking, missing UTMs, and numbers that don't match between systems.

KO detects and highlights these gaps automatically — so you see what's broken and where money is lost.

You don't need perfect data. You need to see what's wrong.

Basic setup takes under 10 minutes: connect ad accounts, connect CRM, add the tracking script.

You'll start seeing data within 24 hours. A fully reliable revenue system is typically ready in ~10 days.

No SQL. No data engineers. No waiting months for results.

Most attribution tools show which channel touched the user. That's a report.

KO shows how much revenue each channel generated, where money is lost in the funnel, and what to fix or scale.

It's not attribution. It's revenue decision-making.

Which campaigns generate real revenue. Where leads drop and money is lost. Which channels to scale or cut. How each stage of your funnel affects revenue.

Not just data. A clear next move.

KO is most valuable for teams spending €10k+ per month on ads and using a CRM.

If you're investing in marketing but can't clearly see what drives revenue — this is exactly the problem KO solves.

No. Standard setup is no-code. If you have custom systems, we handle the integration.

You don't need a data team to get revenue visibility.

Initial data within 24 hours. Most teams identify wasted budget and revenue leaks within the first few days.

In many cases, KO pays for itself in the first month — just by fixing what was already broken.

Still not sure? Let us show you with your real data.

See where your revenue comes from

See what to cut, fix, and scale — using your real data.

See pricing

No credit card  ·  Cancel anytime